
New Jersey Tech, Business, & Creative Resources

Your Marketing Dashboard Is Lying (And Attribution Is Why)

It’s funny how marketing dashboards make complex things look simple. A few colorful charts, some percentages, a few conversion numbers, and suddenly everyone knows where the company’s customers come from.
There’s just one problem: the numbers on your dashboard don’t necessarily tell the whole story.
After discovering your business through an AI search result, researching it through Google, clicking a paid advertisement a week later, and finally making a purchase after receiving an email, a customer might finally make a purchase. So which channel deserves credit for that sale?
Ask Google Analytics 4 (GA4), and the answer will depend on the attribution model you’re using. Ask the customer, and you might get a completely different explanation.
That’s the problem behind Attribution Is Hard, a free interactive simulation created by Bengü Sarıca Dinçer, a measurement-focused contributor to Search Engine Journal.
Instead of burying visitors in analytics terminology, Dinçer uses a simple visual experiment to illustrate how attribution models, missing referral information, and incomplete tracking can distort marketing performance reports.
At a time when AI-powered search is introducing new discovery paths that are hard to capture with traditional analytics tools, it’s a particularly useful exercise.
A CEO, a Dashboard, and a Few Missing Pieces
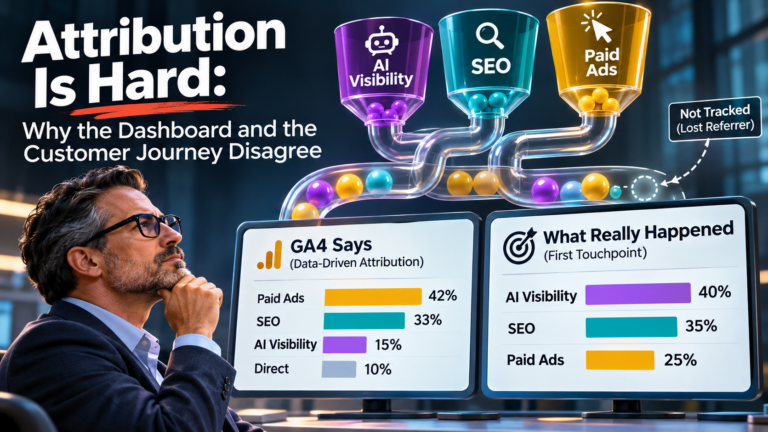
The simulation begins with a CEO character confidently reviewing a marketing dashboard. To see how the reported results change with different scenarios and attribution models, visitors can switch between Google Analytics 4.
The interesting part is how the simulation visualizes customer journeys.
Each sale is represented by a marble traveling through pipes. Based on the marble’s color, you can identify the channel that actually started the customer journey: AI visibility, SEO, or paid advertising. Dashed marbles represent journeys where GA4 cannot identify the original source.
There are two sets of results displayed side by side:
- GA4 says: The conversion credit is assigned according to the selected attribution model.
- What really happened: The actual channel that initiated the customer journey.
The difference between those two views is the entire point.
When the attribution model is changed, the reported contributions of each channel change as well. If referral information is missing, some of the original sources will disappear from the analytics report completely.
As far as underlying sales are concerned, they have not changed. The customers haven’t changed either. The only difference is in the interpretation of the data.
It’s important to note that there is a disclaimer here as well. According to Dinçer, the simulation’s pipe weights are intended to illustrate rather than to reflect actual site performance. Similarly, its data-driven attribution example is a simplified representation, not a replica of Google’s proprietary model.
In other words, don’t use the simulation to calculate your marketing budget. You can use it to understand why the numbers you’re already looking at might need to be reexamined.
Why Your Attribution Model Changes Everything
When a conversion occurs, attribution determines which marketing touchpoints should be credited.
Google Analytics 4 offers different approaches, each of which produces a different interpretation of the same customer journey. Its attribution documentation lists the models currently available (data-driven, paid and organic last click, and Google paid channels last click) and notes that the older first-click, linear, time decay, and position-based models were retired in November 2023. Benjamin Mangold’s guide to GA4 attribution models at Loves Data explains how those models apply to different reports, including the Model Comparison report.
Think of a customer who discovers a company organically, returns through social media, clicks a paid advertisement, and eventually purchases.
When a last-click model is used, the final eligible interaction receives the credit. Other channels used to introduce the brand to customers or build trust are little or never recognized. Google’s documentation also states that attribution models exclude direct visits from receiving credit, unless the entire path was direct.
Based on estimated conversion contributions, a data-driven model distributes credit across touchpoints.
Both approaches do not reveal the customer’s entire thought process. Essentially, they provide different interpretations of available data.
And that’s where things get expensive.
When a marketing director reviews a dashboard, he or she finds that paid search consistently generates more attributed conversions than organic search. A director decides to shift money from SEO to paid advertising.
But what if organic search introduced most of those customers in the first place?
Paid advertisements may have closed the deal, but SEO helped create it.
In the long run, cutting the SEO budget could weaken the very channel that was appearing to be performing so well by reducing the number of people entering the customer journey.
This is why it can be dangerous to look at a single attribution model. Channels that introduce customers don’t necessarily get the last click. However, that doesn’t mean it doesn’t contribute to revenue.
When AI Traffic Disappears Into Direct
Another particularly relevant part of the simulation involves referral tracking.
GA4 uses information such as referral sources, campaign parameters, and other available traffic signals to categorize incoming visits. Its default channel group documentation explains how traffic is classified. Direct, for example, covers users who arrive via a saved link or by entering your URL, while a separate AI Assistant channel is matched on referrers from known AI tools such as ChatGPT, Gemini, Copilot, and Grok. A visit that arrives with no referrer has nothing to match against.
But what happens when that information disappears?
Direct traffic is usually classified as a visit with no identifiable referral source. As people discover businesses through AI tools, this issue is becoming increasingly important.
Marketer Ross Simmonds documented what that looks like in practice: in early October 2026, ChatGPT links stopped carrying their usual utm_source tag and opened without a referrer, so GA4 filed those visits as Direct. A separate analysis by Paul Byrne at SearchIntel found the ChatGPT line in GA4 fell roughly 30% to 46% across the datasets that reported a percentage, and noted that none of the sources saw a change in brand visibility that week. OpenAI acknowledged a bug and began rolling out a fix on October 15. The figures come from small, secondhand datasets, so treat them as directional.
Think about what that means for a company investing heavily in AI visibility.
A member of its marketing team checks GA4 and notices that AI referral traffic appears to be declining. In the meantime, Direct traffic continues to grow.
Perhaps the AI strategy isn’t working, as the obvious conclusion might be.
But that conclusion assumes the analytics platform can identify every visit accurately. Unless referral information is included in the dashboard, the company may be hiding some of its most important traffic statistics.
As Dinçer’s simulation shows, dashed marbles represent that. Sources exist, but the reporting system cannot access them. If decision-makers do not understand that distinction, they may end up cutting investments based on incomplete data.
The Problem With Numbers That Look Too Precise
Another issue worth considering is the growing use of modeled data in modern analytics.
Because of privacy restrictions, browser limitations, consent choices, and fragmented customer journeys, measurement platforms must work with incomplete data.
Modeling can help fill in those gaps. An estimate, however, is not the same as an observation.
This distinction is central to Dinçer’s Search Engine Journal article, When Attribution Looks More Precise Than The Data Behind It, published September 8, 2026.
It’s not necessarily that modeled data is bad. A business might mistake modeled results for behavior they have directly observed.
Seeing 1,247 conversions on a dashboard seems credible. However, if some of those conversions are based on statistical estimates, the apparent precision can create a false sense of security.
Google’s own documentation is open about this. Its consent mode help page says consent mode lets Google model conversions and behavioral data, and that if tags are blocked, behavioral modeling in Google Analytics is unavailable.
It’s important to distinguish between the two.
Having a spreadsheet full of numbers and hoping everyone understands the limitations is not the way to be a good analyst. They need to explain what the data measures, what it estimates, and what it does not prove.
There’s nothing like a little uncertainty over a lot of misplaced confidence.
What Marketers Should Actually Do About It
You don’t have to abandon GA4 or throw away your marketing dashboards. But there is a need for you to become more skeptical when it comes to what they say.
To get started, here are five practical suggestions.
1. Compare its attribution model.
Don’t rely solely on last-click reporting. To understand how channel credit changes, compare different attribution approaches. You might be overlooking valuable contributions due to large discrepancies in your current reporting.
2. Investigate Direct traffic.
Direct traffic doesn’t necessarily indicate stronger brand recognition or more people typing your URL into a browser. You should check for missing referral information, campaign tagging problems, and potential issues with AI referral tracking.
3. Separate measured data from modeled data.
You should clearly distinguish estimated conversions from modeled attribution if the report contains either. If executives are examining observed activity, they should understand the difference between observed and statistical data.
4. Build a measurement framework before configuring analytics.
Instead of focusing on GA4 settings, start with business questions. Avinash Kaushik’s classic Web Analytics 101 makes the same case: pin down your business objectives first, then work out the goals, KPIs, and metrics that follow. What are you trying to understand? Which customer behaviors matter? Which channels introduce prospects, nurture them, and close sales?
These questions should be supported by your analytics configuration.
5. Look beyond the final conversion.
In most cases, customer journeys do not follow a neat, predictable path. Prior to someone making a purchase, pay attention to the channels that introduce customers, generate consideration, and influence decisions.
The Dashboard Isn’t the Customer
The biggest takeaway from Attribution Is Hard is that measuring marketing performance isn’t the same as understanding customer behavior.
An attribution model can facilitate complex conversion journeys, and GA4 can provide valuable information. But neither should be mistaken for an accurate representation of how people discover, evaluate, and eventually purchase products and services.
By making an abstract problem tangible, the simulation succeeds. With the same sales, you can observe different attribution results if you change the model or introduce missing referral information.
Those are useful reminders for anyone making analytics-driven decisions.
Examine the assumptions behind the numbers before cutting your SEO budget, celebrating a paid campaign, or declaring that AI search isn’t working.
Credit isn’t always given to the channel that deserves it. Sometimes, the most important part of the customer journey is not visible on your dashboard.